Stellar Spectral Classification
Matthias Scholz
An analysis of spectral data
and fundamental parameters of stars.
Partner: CIDA - Centro de Investigaciones de Astronomia, Venezuela.
For details see:
J.Stock and M.J.Stock. Quantitative Stellar Spectral Classification. Revista Mexicana de Astronomia y Astrofisica, 34, 143-156, 1999.
Linear analysis of the spectral data space by PCA
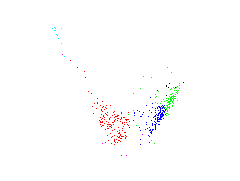
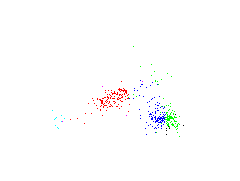
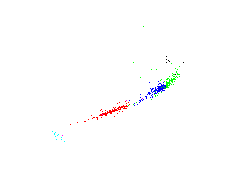
The PCA - Principal Component Analysis is a linear technique to achieve orthogonal directions of highest variance in the data space. The two dimensional subspace spanned by the first two features of PCA are plotted. The first feature is the direction of highest variance in the spectral space. The second feature is the direction of highest variance in the othogonal subspace to the first feature.Fundamental parameters to first feature of PCA
| absolute magnitute | B-V colors | metallicity index |
 |
 |
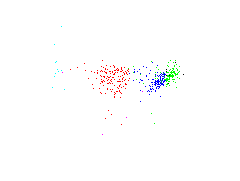 |
The first feature of PCA is plotted against the fundamental parameters. The most interesting diagram is on the left where the first feature is plotted against the absolute magnitude. There are some similarities to a Herzsprung-Russel diagram. There exist something like a 'main sequence' and below a cluster which is maybe represented by 'giants'.
Nonlinear analysis of spectral data space by NLPCA
 |
 |
 |
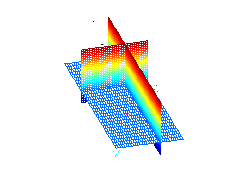
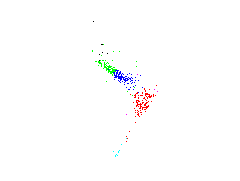
NLPCA - Nonlinear Principal Component Analysis is a nonlinear feature extraction technique similar to PCA except that the features can be nonlinear.
In the middle the data is plotted in the space spanned by the first three features of linear PCA. On the left again the data is plotted and additional the first three features of PCA are plotted as grids. At each grid two features are plotted and the third is set to zero. The grids represent the new coordinate system after the transformation. The linear PCA does not describe the characteristics of the data very well. On the right the first three features of NLPCA are plotted. The NLPCA describes the data much better.
Artificial neural networks are used for the NLPCA transformation, see www.NLPCA.org
Prediction of fundamental parameters
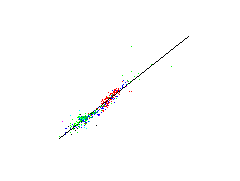
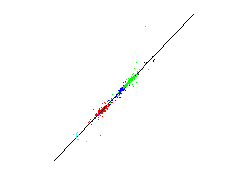
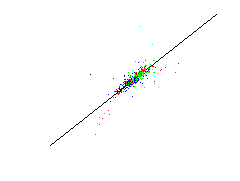
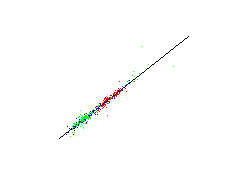
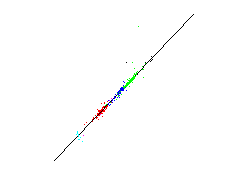
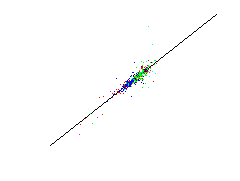
The aim is to predict fundamental parameters from measured spectral data. This means that for a given 19-dimensional spectral data vector the respectiv value of a fundamental parameter shall be predicted by a suitable method. Since such a method shall be used for new unknown stars, a estimation of the prediction error is significant. For that a leave-one-out method of the more general cross-validation technique is used. At this method a single data is omitted from the data set. The prediction methode is adjusted by the residual data and tested on the omitted data. The result is a test error of a data unknown for the prediction method. This process is repeated for each data. The estimated prediction error is the mean over all single test square errors.Below the predictions of the single test data are plotted against there known values. Such a plot is called a scatter plot. The optimal result is if the data lie on a straight line implying that the predicted values coincide with the known values.
First row: a linear methode is used for estimating the fundamental parameters, Second row: a nonlinear neural network is used.
| absolute magnitute | B-V colors | metallicity index |
 |
 |
 |
 |
 |
 |
www.matthias-scholz.de, last modified: October 12, 2000
